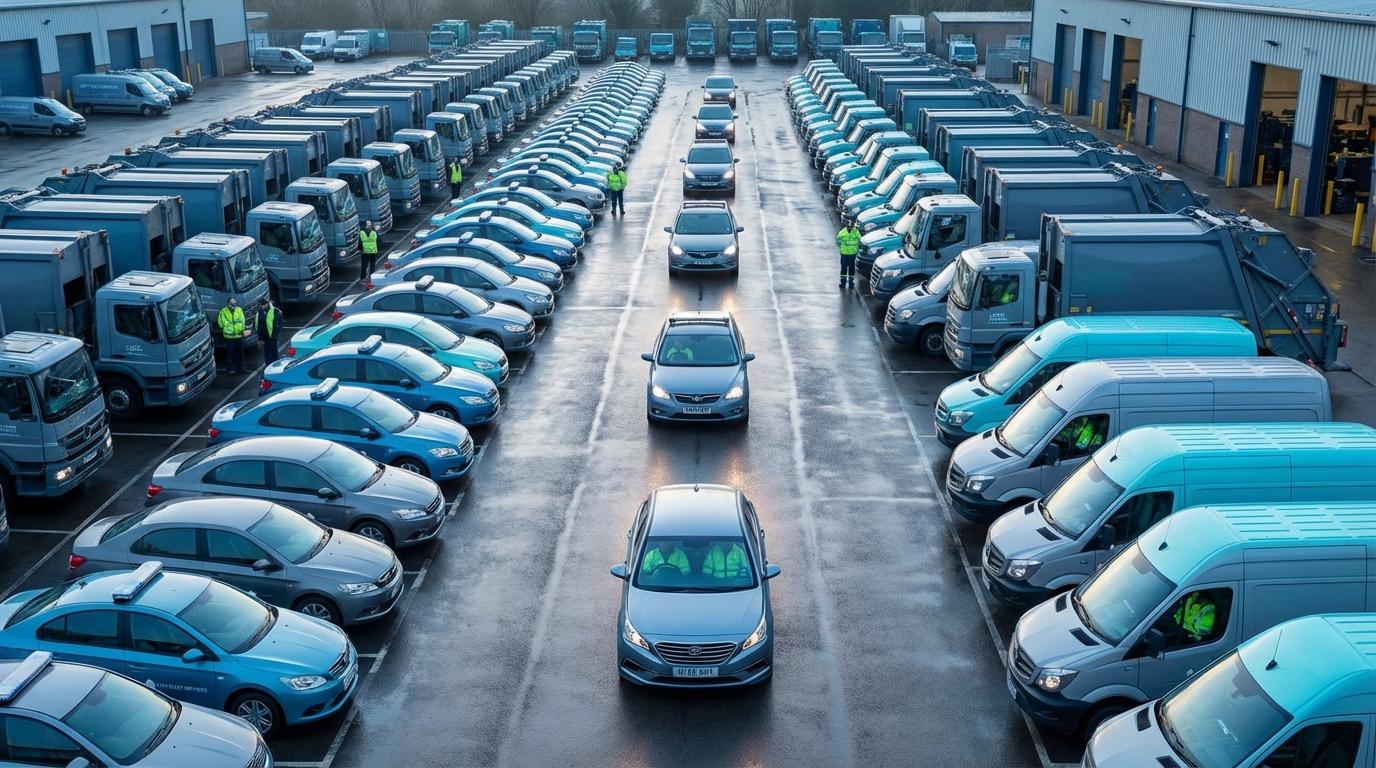
Most cities still run their fleets on a playbook that came from the military, and the assumption baked into it is that a vehicle is a vehicle. In a city fleet that assumption falls apart the moment you look at the parking lot, where a thirty-ton refuse truck sits next to the Prius that code enforcement borrows a few days a week.
The military had the easy version of the problem, since every Humvee is more or less the same Humvee with the same parts and the same service interval.
I learned how badly this translates from the software side. A few years ago I spent most of a year building routing and maintenance tools for the fleet office of a mid-size city, and the first thing we got wrong was routing. We had set up one vehicle profile for the whole fleet, and because the refuse trucks were the most restricted vehicles we owned, every car inherited their limits. Fuel numbers for the sedans looked strange for weeks. Eventually I rode along on one of their routes and watched a Honda Civic take a four-mile detour around a bridge height restriction it could have cleared with a Christmas tree strapped to the roof.
The reason took me a while to see, and it has to do with how routing engines treat restrictions. A height or weight limit doesn’t get added to the map as a slow road or a penalty; the engine deletes the restricted segments from the road graph before it searches for a path, so for any vehicle carrying a truck profile the short road under that bridge simply doesn’t exist. The algorithm was doing its job perfectly when it sent the Civic the long way, and nothing in its output looked wrong. You only catch it if you know which profile each vehicle was given, which is why the fix was a single config change and the diagnosis took most of a month.
Sorted by Who Pays
Every city groups vehicles by department because that’s how the money flows. Police has its own line item, and so does every other department down to building inspection. That arrangement suits accounting and does real damage to operations, because two departments running the same model of pickup will maintain them on different schedules with parts from different vendors, and neither one knows when the other’s truck is sitting idle.
The city I worked with had a clean example of this. Parks needed a pickup for a week-long planting project and rented one from Enterprise, while public works had identical trucks parked at the maintenance yard because their operators were on vacation. Nobody asked, since the trucks sat in different budgets, and as far as anyone’s paperwork was concerned they might as well have belonged to different cities.
Group vehicles by class first and department second, so every pickup in the city shows up in one list regardless of which department drives it.
Service Intervals That Match the Machine
A mechanic at the city garage put it better than I could: “They want me to service the trash truck and the inspector’s Prius on the same interval. One of them gets hydraulic fluid cooked to sludge every week. The other one mostly sits in parking lots and judges people’s lawn height.”
Most maintenance intervals are built around one variable, usually mileage, and ignore the rest. A police cruiser idles for hours in stop-and-go traffic and piles up engine wear that the odometer barely records. Snowplows can cover modest distances while running their hydraulics under heavy load for an entire shift. A mileage schedule gets both of them wrong in opposite directions, and calendar schedules aren’t much better because they assume steady use, which municipal work almost never has.
What worked for us was servicing on miles or calendar days, whichever came due first. Equipment with a power take-off (PTO) needs its own hour counter on top of that, because on a street sweeper or a bucket truck the time the auxiliary systems run says far more about wear than the odometer does. If you aren’t logging PTO hours separately, the service date for those rigs is a guess.
The telematics question
Paper logs work for a while, since drivers fill them in honestly until the novelty wears off and the forms start coming back blank. Onboard telematics fixes the data problem and adds diagnostic codes and idle time to the picture. Whether the budget stretches to it is a separate argument, but if it does, the most expensive vehicle classes are where I’d start.
Same van, different life
Animal control ran a matched pair of vans, same year and model, in different zones. The first covered mostly highway miles out to rural calls, while the other crawled through dense neighborhoods over broken pavement, and after a few years the highway van still drove tight while the city van needed suspension work and new brakes.
That gap is why fixed replacement cycles waste money. Retire everything on a rigid schedule and you’ll scrap vehicles with years left in them while keeping others that should have gone a season earlier. Condition-based replacement takes more administration, since someone has to track cumulative repair cost per vehicle and flag the point where ongoing repairs exceed what a replacement would cost per year. The calculation was running early on, but getting anyone to act on it before the council heard about the refuse truck that broke down mid-route for the fourth time took most of the year.
The fleet manager also drove every vehicle himself at least once a year, which I thought was sentimental until he put me in a van whose transmission hesitated in a way no sensor ever reported.
Fuel Sprawl
A municipal fleet might burn diesel, gasoline, compressed natural gas and electricity, each with its own price swings and its own paperwork. It creeps up gradually, and one day you notice the fuel cards and fueling sites have multiplied and there’s no single place showing what the fleet spends on energy.
Centralize the tracking even if the fueling stays scattered, with every fill-up logged against mileage. A refuse truck that suddenly burns noticeably more diesel usually has something mechanical going wrong. When a sedan fuels far more often than its twin on the same route, you’re looking at either a driver issue or a leak, and you won’t catch either one while diesel and gasoline live in separate spreadsheets that nobody compares.
Who Gets New Vehicles This Year
Fleet budgets in a city are department budgets, and department budgets are political. The police chief wants new cruisers, while public works points out that a single plow costs as much as several of them, and everyone in the room has a real need.
The fleet office’s job in that meeting is to bring numbers that cut through the advocacy, mainly total cost of ownership per vehicle and the repair trend for each unit. With those on the table, you can show the chief which cruisers actually need replacing and which have life left, and the money freed up can go to the plow that would otherwise strand a crew in a January storm.
Capital replacement reserves help a lot here, because each vehicle gets a fixed annual contribution into a dedicated fund, so when a unit reaches its replacement point the money is already there and nobody has to win that year’s budget fight to get it.
Shared Pools and the Hoarding Problem
A lot of municipal vehicles spend most of the workday parked.
Department heads resist sharing because they want a vehicle the moment they need one, which is understandable. The catch is that every extra unit carries insurance, maintenance, parking and registration whether it moves or not, and that cost compounds quietly for vehicles that mostly sit.
A tiered setup is the usual compromise. Roles that need a vehicle all day, like patrol and refuse collection, keep dedicated ones. Building inspectors and code enforcement officers, who need a car a few times a week, book from a shared pool through a reservation system, which stops hoarding without leaving anyone stranded. The first month of that was rough at our city. People mostly got used to it, although one department head kept a spare key in his desk drawer for a long time afterward, and as far as I know nobody ever made him give it back.
Tracking Without Drowning in Data
A mixed fleet produces a huge amount of data: mileage, fuel, maintenance records, inspection logs, registrations, accident reports, warranty claims. The temptation is to build one system with a field for every one of them, and then watch nobody use it because entering the data takes longer than the work.
Start with cost per mile and downtime percentage for each vehicle, and pull in everything else only when one of those moves. A jump in cost per mile sends you into the maintenance history. When fuel efficiency drops on a route that hasn’t changed, the cause is either mechanical or a routing problem worth investigating with better road data.
All of that is about the trucks, and the crews are a separate question. When a water main breaks, what you need to know is which crew is nearest and how long they’ll take to get there, and if the crew members carry phones, live location and ETAs for field crews can answer that without any hardware in the vehicles. After the fact, if the crew was sharing location during the shift, a trip replay shows where they actually went, which settles a resident insisting their street was skipped or a plow route someone reported as finished. None of it tells you anything about hydraulic fluid, so it sits next to the vehicle data rather than replacing it.
Review the reports weekly, because monthly reviews drift to quarterly and then to annual, and by then someone discovers a vehicle has been out of service for months while the department quietly borrowed personal trucks.
Where to Start When Everything Needs Fixing
If you’ve inherited a mixed fleet and all of it feels broken, start with maintenance spend. Sort the records by total cost per vehicle, and the top slice is where the biggest savings are, because those units are either past their useful life or stuck on a recurring failure that a different approach could fix.
Then look at what downtime costs. A sedan off the road for a week is an inconvenience, while a garbage truck off the road for a week means missed routes and calls to the council.
The city I worked with had around a hundred and fifty vehicles, and the mistake that cost us the most early on was the one behind that Civic’s detour: we treated them as one kind of vehicle because the software made that the easy default. Once each class had its own profile, the Civic went under the bridge like every other car in town, and the sedan fuel numbers stopped looking strange about a month later.